LBTH - WAPPING BUS GATEWAY - Interim Review Report - 26/8/20

Table of Contents
Data collection and limitations
Traffic Levels and Speed in Wapping
Traffic levels. 9Vehicle speeds
Identified residents’ issues. 21Blue badge holders
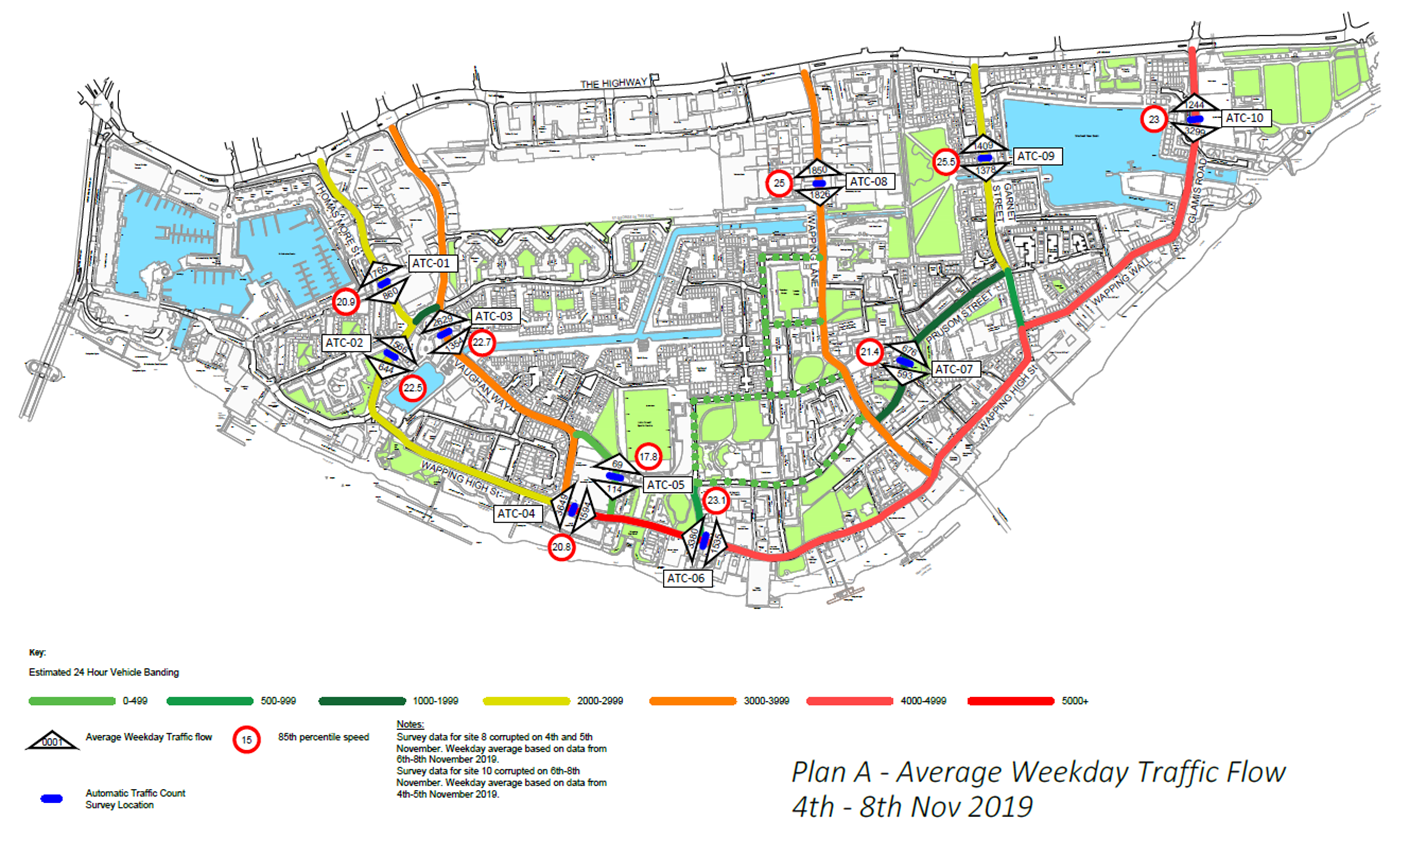
Average weekday traffic flows 4th to 8th November 2019
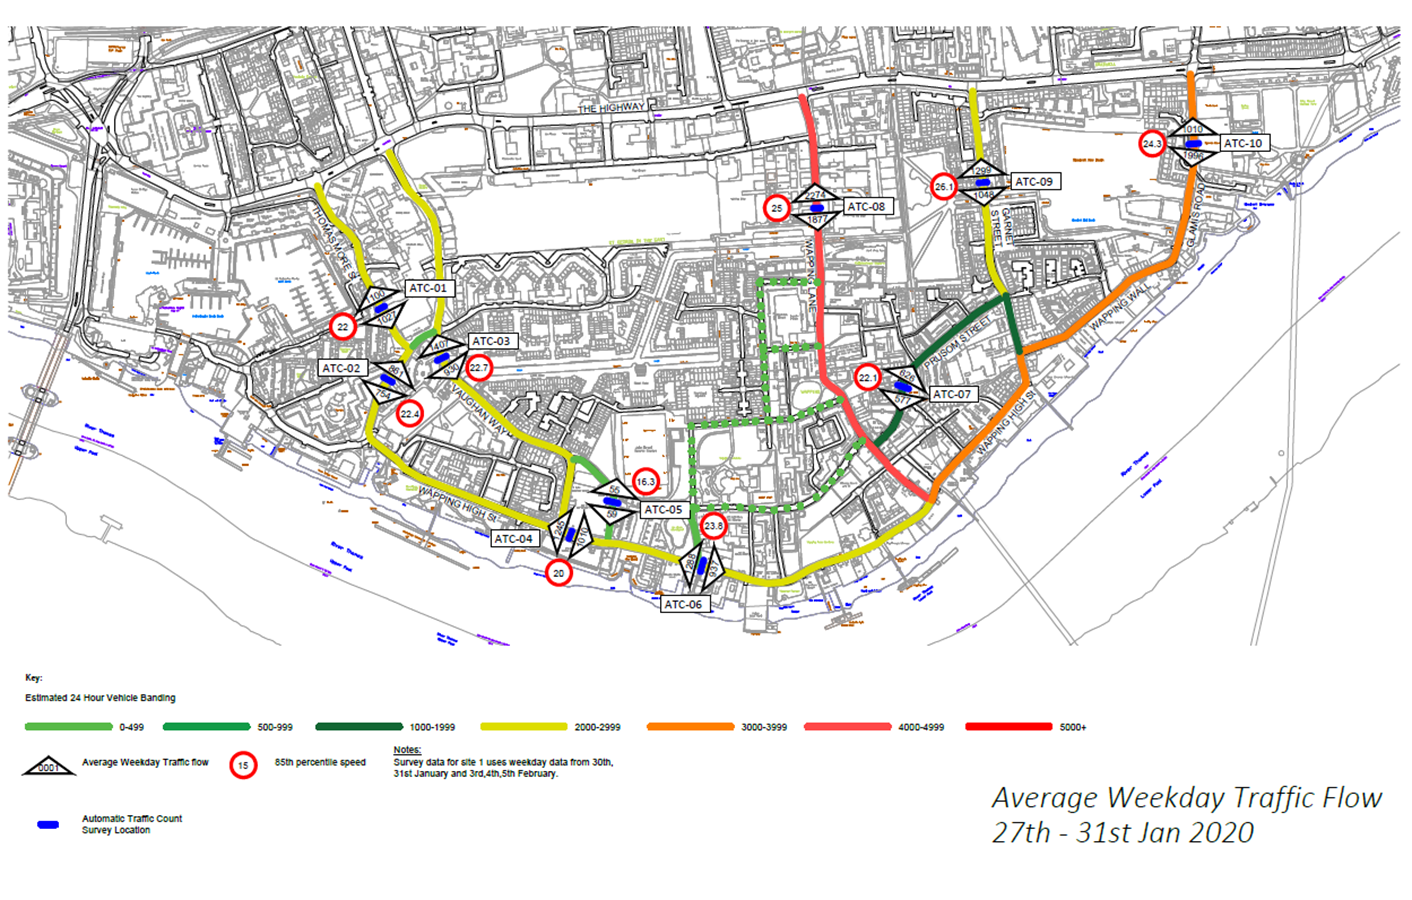
Average weekday traffic flows 27th to 31st January 2020
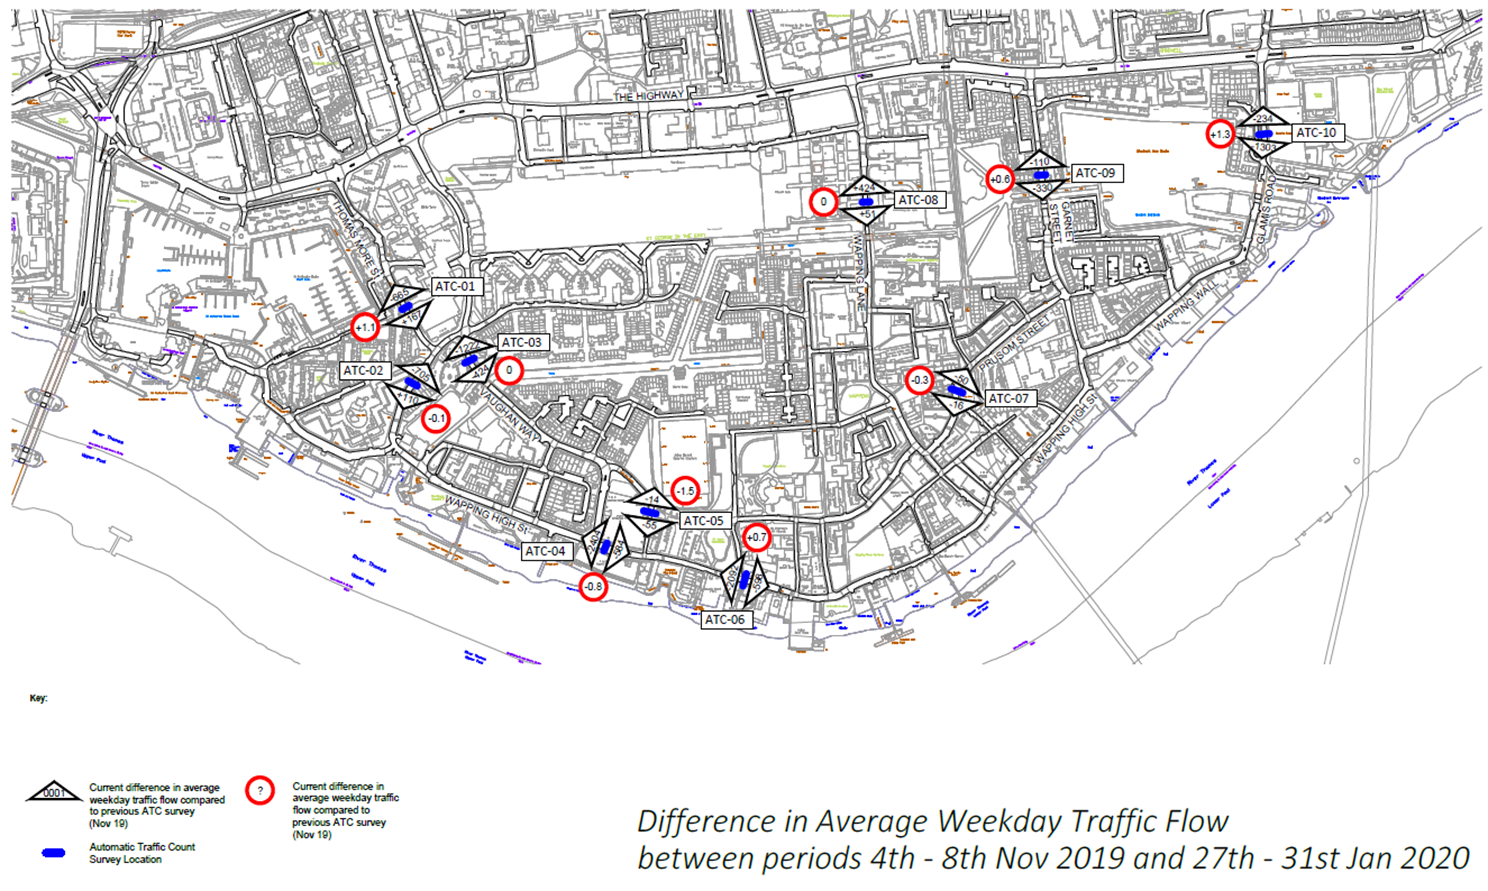
Difference in average traffic flows and speed – before and after gateway
Introduction
Background
Following a review of traffic management issues in Wapping and a public consultation that was held between 21st February and 8th April 2019, the Bus Gateway was introduced on Wednesday 13th November 2019. The gateway is aimed at improving safety and reducing noise and air pollution for residents who suffer from thousands of vehicles using the road as a shortcut in and out of central London. This restriction was installed on Wapping High Street between Sampson Street and Knighten Street and operates from 05.30 -10.30 and 16.00-19.00 Monday to Friday. There are no exemptions other than buses and pedal cycles. This means no motorcycles and taxis pass through. A complementary road closure was installed on Knighten Street to prevent the development of a further rat-run created by motorists attempting to avoid the bus gateway on Wapping Lane.
Experimental traffic orders
The restrictions were installed via an Experimental Traffic Order. This enables the council to review and understand the impact of the restriction and make any required changes. Experimental Traffic Orders last for 18 months, within the first 6 months changes can be made to the order for the scheme to run smoothly. During this 6-month period, users can raise an objection or comment on the order. Between 6 and 18 months, the council can make one of three choices:
- Remove the restriction and stop the traffic order
- Make the traffic order permanent
- Make changes to the restriction and start the 18-month experimental traffic order again.
Interim Review
This interim review is to understand the impact the bus gate restriction has had on the road network and if there is a requirement to make changes to the current experimental traffic order to ensure its operation is effective and appropriate to continue until a full review is carried out. Sections 3-7 of this report look at the data we have collected since the restriction was put in place. Chapters 8-9 details information we have received from residents, council departments and other road users.
Data collection and limitations
For a review of the gateway to be completed in summer 2020, and the required lead times for changes to the traffic order and associated infrastructure, the information in the report is limited to a “snapshot” of the impact of restrictions. A more detailed review will take place in spring 2021 when a full 12 months of data will be available from all sources. Due to the short window of comparable “after” data, it is possible for on-site issues (for example emergency road works) to cause a misrepresentation of an average day. This can be reduced by gathering data over a longer period. Some of the topics within this report include issues raised by residents, businesses and car users but should not been a consultation on the scheme. The feedback that officers have received is variable with many pleased with the reduction in traffic levels but included, a petition with more than 2,000 signatures was received, requesting residents and taxis to be allowed exemptions but it is not clear how many of the signatories are residents and workers in Wapping.
Operating Times
Background
The gateway was introduced to reduce the number of vehicles using Wapping High Street, causing heavy congestion, leading to poor conditions for local residents. Many of the vehicles travelling through Wapping and particularly Wapping High Street are those looking to avoid congestion on The Highway. Considering this and the movement of local residents, the times of operation are based on the peak flows.
Highway flows – westbound
Journey times for The Highway have been supplied by Transport for London (TfL) for the westbound direction from Brodlove Lane to Tower Hill on weekdays from 13/09/2019 to 13/11/2019 An average has been taken for this period and presented in the graph below.
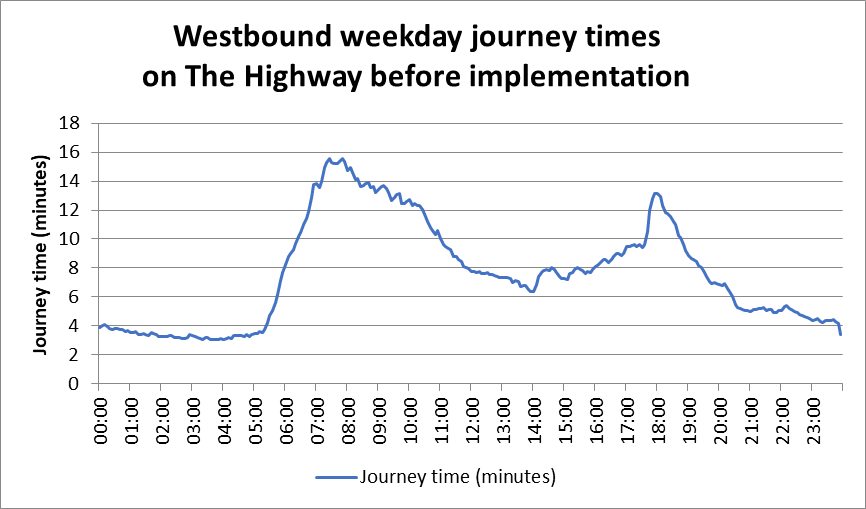
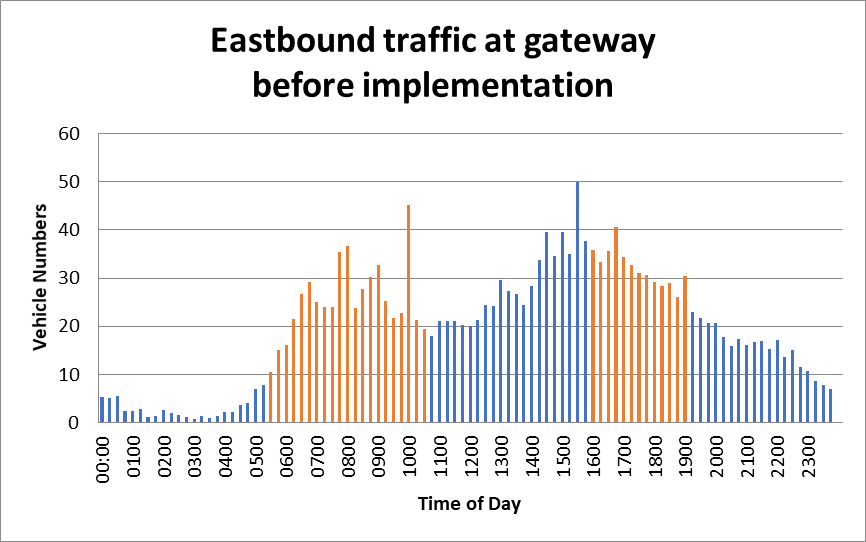
There is a clear spike in journey times starting at 05:15 which aligns with the Automatic Traffic Count (ATC) surveys conducted in Wapping at the location of the gateway, taken during the design phase of the scheme:

Highway flows – eastbound
For the eastbound direction, the Automatic Number Plate Recognition (ANPR) data for The Highway is taken from Dock Street to Aspen Way at the junction with Upper Bank Street, incorporating journeys through the Limehouse Link Tunnel. Although useful for the Wapping area analysis, will be affected by traffic from other roads including Butcher Row.
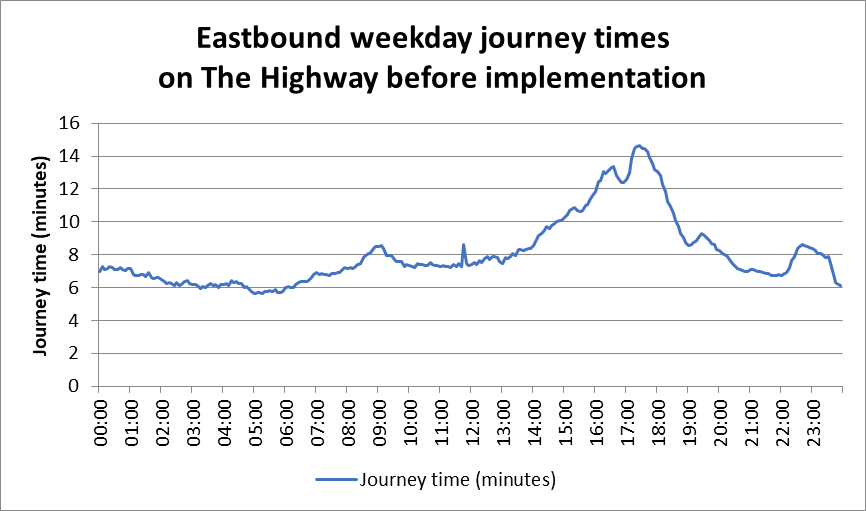
There is a clear spike in journey times in the evening peak, which correlates with an increase in traffic in Wapping.
With exception of a peak at 1530, which is most likely linked to school related traffic, the restriction times cover the busiest times on the Highway and within Wapping.
Conclusion
The data obtained shows a clear correlation between journey times (east and westbound) on The Highway and traffic counts at the gateway location. Therefore, the operating times of the gateway restrictions address the peaks in journey times on The Highway and vehicle numbers travelling through Wapping.
Traffic Levels and Speed in Wapping
Traffic levels
Ten automatic traffic counters were placed in Wapping to monitor traffic levels before and after the restriction was implemented. The counters recorded vehicle numbers for an average weekday in two directions, vehicle types and speeds. The before surveys were taken from 4th to 8th November 2019 and the after surveys from 27th to 31st January 2020.
| Location | Direction | 4th - 8th Nov 2019 | 27th - 31st Jan 2020 | Difference | % Change |
| ATC1 Thomas More Street (north) | Northbound | 1765 | 1100 | -665 | -38% |
| Southbound | 860 | 1027 | 167 | 19% | |
| ATC2 Thomas More Street (south) | Northbound | 1566 | 861 | -705 | -45% |
| Southbound | 644 | 754 | 110 | 17% | |
| ATC3 Vaughan Way | Northbound | 2629 | 1407 | -1222 | -46% |
| Southbound | 1354 | 930 | -424 | -31% | |
| ATC4 Wapping High Street (west) | Westbound | 3649 | 1245 | -2404 | -66% |
| Eastbound | 1594 | 1010 | -584 | -37% | |
| ATC5 Knighten Street | Northbound | 69 | 55 | -14 | -20% |
| Southbound | 114 | 59 | -55 | -48% | |
| ATC6 Wapping High Street (east) | Westbound | 3380 | 1288 | -2092 | -62% |
| Eastbound | 1535 | 937 | -598 | -39% | |
| ATC7 Prusom Street | Northbound | 676 | 626 | -50 | -7% |
| Southbound | 593 | 577 | -16 | -3% | |
| ATC8 Wapping Lane | Northbound | 1850 | 2274 | 424 | 23% |
| Southbound | 1826 | 1877 | 51 | 3% | |
| ATC9 Garnet Street | Northbound | 1409 | 1299 | -110 | -8% |
| Southbound | 1378 | 1048 | -330 | -24% | |
| ATC10 Glamis Road | Northbound | 1244 | 1010 | -234 | -19% |
| Southbound | 3299 | 1996 | -1303 | -39% | |
| TOTAL | 31434 | 21380 | -10054 | -32% |
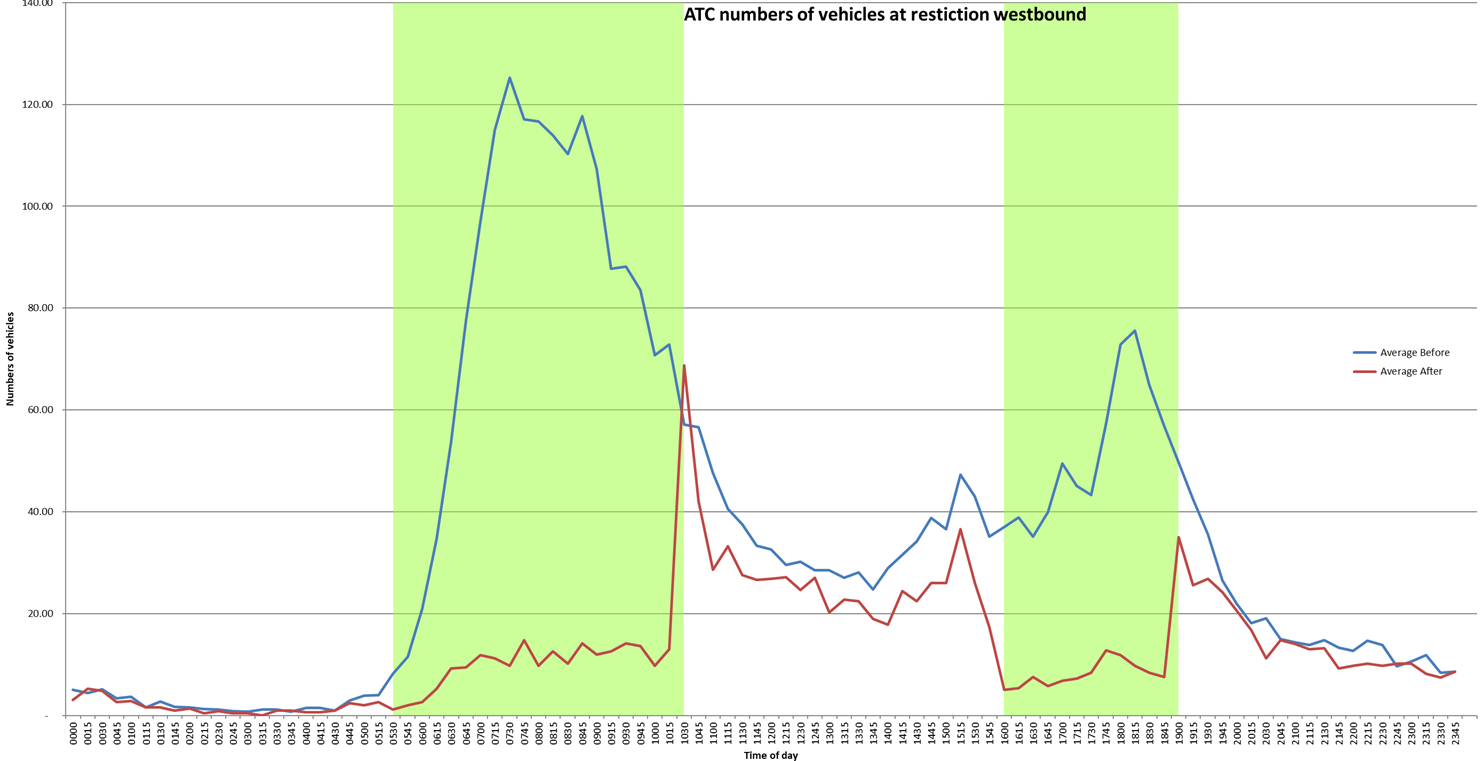
Overall, there has been a 32% reduction in traffic across Wapping traffic counters during the week; more than 10,000 vehicle movements have been removed from the area on average. Following the implementation of the gateway, all roads except Thomas More Street (southbound) and Wapping Lane (northbound & southbound) have seen a decrease in average vehicle numbers. Traffic has increased on Thomas More Street by around 18% and on Wapping Lane by 23%. However, these increases are significantly less than the decrease in traffic seen across Wapping as a whole. At the restriction location, there has been an overall reduction in traffic both during the hours of operation and throughout the day. The following graph sets out before and after numbers of vehicles passing the ATC and the times of restriction operation.

It is clear that not only “rat running” has reduced at peak times through Wapping but overall vehicle numbers have also reduced in the area which aligns with the scheme’s objectives to help make sustainable transport modes more attractive. On an average day in January, the increase in vehicles on The Highway does not match the decrease in the numbers of vehicles in Wapping. This implies there is an element of traffic displacement within the wider area.
Vehicle speeds
Vehicle speeds in Wapping have remained broadly constant following the implementation of the restriction. The table below includes 85th percentile speeds in miles per hour (mph) for vehicles passing the automatic traffic counters (ATC) in Wapping.
| Location | 4th - 8th Nov 2019 | 27th - 31st Jan 2020 | Difference | % Change |
| ATC1 Thomas More Street (north) | 20.9 | 22 | 1.1 | 5.0% |
| ATC2 Thomas More Street (South) | 22.5 | 22.4 | -0.1 | -0.4% |
| ATC3 Vaughan Way | 22.7 | 22.7 | 0 | 0.0% |
| ATC4 Wapping High Street (west) | 20.8 | 20 | -0.8 | -4.0% |
| ATC5 Knighten Street | 17.8 | 16.3 | -1.5 | -9.2% |
| ATC6 Wapping High Street (east) | 23.1 | 23.8 | 0.7 | 2.9% |
| ATC7 Prusom Street | 21.4 | 22.1 | 0.7 | 3.2% |
| ATC8 Wapping Lane | 25 | 25 | 0 | 0.0% |
| ATC9 Garnet Street | 25.5 | 26.1 | 0.6 | 2.3% |
| ATC10 Glamis Road | 23 | 24.3 | 1.3 | 5.3% |
The plans showing counter locations, traffic volumes and vehicle speeds before and after implementation of the gate plus differences between the two data sets can be found in Appendix 1
Conclusion
The data obtained through traffic counts over the last six months has shown an overall reduction in traffic levels in Wapping for both peak and off-peak journeys. Whilst the overall assessment of the results so far are positive and have shown the bus gateway to be achieving the objectives set out, further investigation work is needed to mitigate the impact on vehicle numbers and speeds in Wapping Lane and Thomas More Street. This investigation will be undertaken over the next 12 months as more data is collected and more detailed analysis can take place.
The Highway
Traffic levels
Due to utility works on the Highway, it has not been possible to collect a similar time period of after data to provide an average as the pre-implementation data displayed above. Transport for London (TfL) have provided traffic data from 06/01/2020 to 03/02/2020. The chart below compares journey times on the Highway westbound & eastbound before and after implementation of the gate:

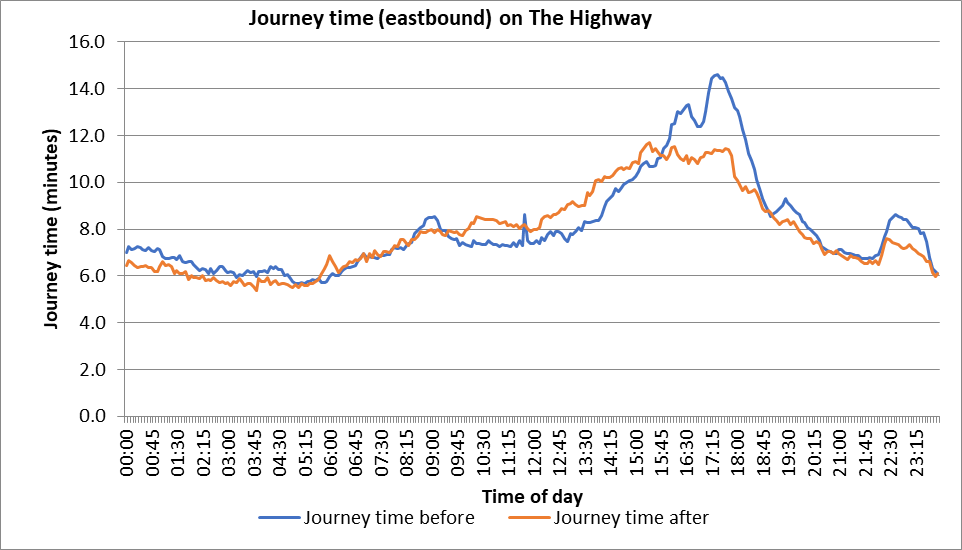
For westbound traffic, the survey was taken from Brodlove Lane to Tower Hill and the eastbound from Dock Street to Aspen Way at the junction with Upper Bank Street incorporating journeys through the Limehouse Link Tunnel. Following implementation of the gateway, journey times westbound increased in line with the hours of operation.
| Journey time | Westbound | Eastbound | ||
| (mins) | 13/09/2019 to 13/11/2019 | 06/01/2020 to 03/02/2020 | 13/09/2019 to 13/11/2019 | 06/01/2020 to 03/02/2020 |
| AM (05:30-10:30) | 12.3 | 14 | 7.1 | 7.2 |
| PM (16:00-19:00) | 10.1 | 9.7 | 12.5 | 10.6 |
The initial data indicates that there has been an impact on tidal journey times in the AM peak westbound. Journey times have increased by approximately 1.7 mins. In the PM peak eastbound journeys have decreased by approximately 2.1 minutes. However, other factors including traffic joining from Butcher Row could have had an impact on the journey times, particularly as the eastbound data incorporates the Limehouse Link Tunnel and Aspen Way. In summary the morning westbound journey times have increased by 13.82% and the evening eastbound journey times decreased by 15.2%. The opposite journeys have remained fairly constant. Transport for London have provided average traffic flows for The Highway (an ATC between Wapping Lane and Cannon Street Road) to compare pre and post-implementation. There was a small increase in numbers of vehicles using The Highway, a 7.1% increase in the morning period westbound and a 3% increase in the evening eastbound. A table with results can be found below containing figures for the average daily weekday totals:
| Av Daily Weekday flow | Westbound | Westbound | Difference | Percentage Change |
| 13/09/2019 - 13/11/2019 | 16/01/2020 - 03/02/2020 | |||
| AM (05:00 - 11:00) | 1036.4 | 1109.6 | 73.2 | 7.10% |
| PM (16:00 - 19:00) | 1160.2 | 1165.9 | 5.8 | 0.50% |
| Av Daily Weekday flow | Eastbound | Eastbound | Difference | Percentage Change |
| 13/09/2019 - 13/11/2019 | 16/01/2020 - 03/02/2020 | |||
| AM (05:00 - 11:00) | 1065.9 | 1098.8 | 33 | 3.00% |
| PM (16:00 - 19:00) | 1489.6 | 1483 | -6.6 | -0.40% |
Conclusion
Following the implementation of the gateway, there were small increases in morning peak journey times on The Highway and vehicle numbers during the operational times. A further review of the impact of the gateway on the Highway will be carried out in 2021.
Signage Review
Regulation signage
Project Centre have undertaken a review and completed a report on the existing signs, lines and traffic order for the restriction, including potential improvements. This separate report recommends several areas of improvement, including an increase in lighting and numbers of signs but confirms that the layout is appropriate and there is a sufficient level of advance warning on all approaches to the gateway. The report can be found here: Appendix 2
Impact on buses
100 and D3
Transport for London has provided journey times and reliability data for the D3 and 100 buses that serve Wapping. The run times for the D3 and the 100 has broadly stayed the same following the implementation of the restriction. Any improvement is focused around the evenings and early mornings with the D3 gaining more than 100 but is minimal. There has been a significant improvement in reliability of the D3 and 100 following the implementation with a gain in the estimated wait time for a bus. The probability of waiting less than 10 minutes has improved along with a reduced probability of long gaps and lower maximum gaps in the service. A full breakdown of figures is available but as with other data within this report the before and after data available is limited at this time due to TFL’s method of capturing data. Further investigation is required as part of a long term review.
Impacts on air quality
To assess the impact on air quality, we have measured particulate matter of 10 micrometres or less (PM10) and 2.5 micrometres or less in diameter (PM2.5). These microscopic particles are the most harmful form of air pollution due to their ability to penetrate deep into the lungs and bloodstream causing heart attacks, respiratory disease and premature death. The table below compares 5 days in the evening peak before and after implementation. Unfortunately, the data for the morning peak has become corrupted, most likely due to power failure. Following the operation of the restriction, particulates on Wapping High Street have reduced; therefore the restriction has had a positive impact at that location.
| Hourly values evening | PM2.5 (µg/m³) | PM10 (µg/m³) | Hourly values evening | PM2.5 (µg/m³) | PM10 (µg/m³) | PM2.5 (µg/m³) Change | PM10 (µg/m³) Change | ||
| Before | 04/11/2019 16:00 | 2.5 | 5.6 | After | 27/01/2020 16:00 | 0.9 | 2.3 | -64% | -59% |
| 04/11/2019 17:00 | 2.6 | 7.1 | 27/01/2020 17:00 | 1.3 | 2.6 | -50% | -63% | ||
| 04/11/2019 18:00 | 2.6 | 7.3 | 27/01/2020 18:00 | 2.9 | 4.4 | 12% | -40% | ||
| 05/11/2019 16:00 | 2.9 | 7.9 | 28/01/2020 16:00 | 1.6 | 5.7 | -45% | -28% | ||
| 05/11/2019 17:00 | 2.9 | 8.5 | 28/01/2020 17:00 | 1.7 | 5.7 | -41% | -33% | ||
| 05/11/2019 18:00 | 2.9 | 8.9 | 28/01/2020 18:00 | 2.7 | 8.1 | -7% | -9% | ||
| 06/11/2019 16:00 | 3 | 9 | 29/01/2020 16:00 | 4 | 15.8 | 33% | 76% | ||
| 06/11/2019 17:00 | 3.1 | 9 | 29/01/2020 17:00 | 4.4 | 16.9 | 42% | 88% | ||
| 06/11/2019 18:00 | 3.9 | 9.1 | 29/01/2020 18:00 | 4.9 | 17.9 | 26% | 97% | ||
| 07/11/2019 16:00 | 4 | 10.6 | 30/01/2020 16:00 | 1.5 | 2.2 | -63% | -79% | ||
| 07/11/2019 17:00 | 4.1 | 10.6 | 30/01/2020 17:00 | 1.1 | 1.7 | -73% | -84% | ||
| 07/11/2019 18:00 | 4.5 | 10.8 | 30/01/2020 18:00 | 1.4 | 2.2 | -69% | -80% | ||
| 08/01/2020 16:00 | 6 | 11.5 | 31/01/2020 16:00 | 0.8 | 1.9 | -87% | -83% | ||
| 08/01/2020 17:00 | 8.7 | 13.3 | 31/01/2020 17:00 | 1.1 | 2.5 | -87% | -81% | ||
| 08/01/2020 18:00 | 9.2 | 14.4 | 31/01/2020 18:00 | 0.9 | 2 | -90% | -86% |
It is worth noting that this result is a snapshot and further investigation is required when a longer period of data is available.
Council department feedback
Feedback
Clean and Green Department have confirmed they have not been made aware of any negative impact on the service following the implementation of restrictions. Transport Services have confirmed that they are not aware of any negative impact on the service following the implementation of the bus gateway. However, the manager has confirmed they have had to resolve a number of Penalty Charge Notices issued in error during an issue with the PCN software. The Metropolitan Police / Community Safety have advised they have not noticed any real difference in ASB or crime since the restriction was implemented. Antisocial behaviour that occurs in Wapping tends to be seasonal and occurs at the following locations: Shadwell Basin - people swimming/drinking/smoking cannabis whenever the sun is out. Hermitage Gardens and surrounds – attracts gatherings of people here in the evenings and early mornings to talk, smoke, drink alcohol and inhale nitrous oxide. Riverside Gardens/Wapping Woods – alcohol, cannabis and nitrous oxide use Nightclubs and organised events in Pennington Street – attracts people under the influence of drink and drugs, leaving litter and nitrous oxide bottles Although Officers have received anecdotal comments from residents that Wapping “feels” more dangerous due to traffic levels and therefore natural surveillance reducing, there is no data to support this.
Conclusion
Officers have not received any feedback from within the Council that the gateway has caused a negative impact on services.
Resident feedback
Email response
Following the launch of the gateway, residents were provided the opportunity to feedback on its operation. In total, 179 e-mails were received from 13/11/19 till 13/03/20. This table summarises the feedback received:
| Total count | % | ||
| Total number of respondents | 179 | n/a | |
| Respondent | Local Resident | 133 | 74 |
| Local Business | 1 | 1 | |
| Vistor | 6 | 3 | |
| Work in Area | 8 | 4 | |
| Don’t know/ neutral | Don’t know/ neutral | 1 | 1 |
| Supportive | Support - as current | 34 | 19 |
| Support - suggests changes | 47 | 26 | |
| Not supportive | Not in favour | 20 | 11 |
| Not in favour - suggests changes | 51 | 28 | |
| Time changes | longer | 15 | 8 |
| shorter | 4 | 2 | |
| Exemptions | Taxi | 36 | 20 |
| Residents | 61 | 34 | |
| Disabled | 24 | 13 | |
| EV | 3 | 2 | |
| Medical/Drs on call | 1 | 1 | |
| Emergency services | 3 | 2 | |
| No Exemptions | 8 | 4 | |
| No comment on exemptions | 43 | 24 | |
| Observations/Suggestions | Increase/better signage | 36 | 20 |
| Signage location suggestions | 3 | 2 | |
| Increased speed of vehicles/traffic calming requests | 13 | 7 | |
| physical barrier/bollards etc | 1 | 1 | |
| narrow carriageway/make bus gate more obvious | 1 | 1 | |
| increase pollution | 4 | 2 | |
| General query | General query | 18 | 10 |
| Query about PCN/fine | 8 | 4 |
45% of those who contacted the Council regarding the bus gate were in support of the restriction. Included within the support 19% wanted to maintain the current restrictions and 26% with some amendments.
- 25 people thought residents should be allowed
- 20 people thought the signage could be improved, more/illuminated etc, 3 gave specific locations
- 13 people thought taxis should be allowed
- 12 people thought the hours of operation should be longer up to 24/7
- 9 people thought those with disabilities should be allowed
- 3 people reaffirmed that no exemptions should be allowed
- 2 people thought the hours of operation should be shorter
- 1 person thought electric vehicles should be allowed
- 1 person thought emergency services should be allowed
39% of those who contacted the Council didn’t support the gateway as it currently operates. Within those against, 11% were completely against the gateway and 28% suggested some changes:
- 36 thought residents should be allowed
- 20 people thought taxis should be allowed
- 13 people thought those with disabilities should be allowed
- 7 people thought the signage should be improved
- 2 people said it should be shorter
- 2 person thought emergency services should be allowed
- 1 person thought doctors on call should be allowed
- 1 person said the restrictions times should be longer.
Conclusion
As was found during the initial consultation, the feedback received shows that the restriction divides opinions in Wapping. There have been no formal objections to the Experimental Traffic Order at this time. The main changes that are requested are to add exemptions to the bus gateway. We propose that a limited exemption for Blue Badge holders living south of the Highway is introduced. Any further exemptions would risk undermining the benefits of the scheme in terms of reduced vehicle movements through and around Wapping.
Identified residents’ issues
Blue badge holders
Feedback has been received from residents that there has been a negative impact on disabled residents since the implementation of the restriction due to taxis and blue badge users being required to join the Highway to access parts of Wapping. There are currently 6000 blue badges in the borough and 165 active in E1W Colleagues from Project Centre have met with REAL, a group concerned with issues for disabled residents. They provided the following feedback: There were different opinions from within the group regarding the scheme in relation to accessibility for disabled users. Some felt it was positive because of increased independent travel opportunities and improved road safety. Another thought it had a negative effect mainly in relation to black cab access. Discussions were also had about how REAL could help to quantify the numbers of disabled users using black cabs, in Wapping in particular.
Doctor surgeries
We have received requests that doctors from Wapping surgery on call should have a dispensation to pass through the restriction. Ambulances travelling for emergency purposes are allowed to pass through the bus gateway without restriction. Conversations with the surgery about the need for dispensations should continue in the months ahead.
Businesses
Some feedback is claiming that the shops in Wapping and in particular Wapping Lane are negatively impacted due to a reduction in passing traffic and a loss of trade. However, this is not reflected in the traffic counts for Wapping Lane, on an average day and during the restriction hour’s traffic in Wapping Lane traffic levels have increased.
PCN
Some drivers have appealed against PCNs with the most common reason for a challenge being the driver didn’t see the signage or were unaware of the introduction of the gateway on Wapping High St. Some drivers have also challenged the issue of the advance signs and the method of restriction. To address this a signage review was carried out and can be found in section 5 and appendix 2
Motorbikes
During an average week (ATC data collected before implementation), 577 motor bikes passed the restriction westbound and 457 travelled eastbound. Allowing motorbikes to pass through the gateway would protect Knighten Street from motorbikes looking to avoid the restriction and would bring the bus gateway policies in line with the fact that motorbikes are generally allowed to use bus lanes in London. However, allowing these journeys to pass through the restriction would undermine the benefits of the bus gateway, allowing these journeys to return to roads in Wapping. The noise, safety issues and emissions from motorbike journeys mean that continuing with the current policy of not exempting motorbikes should continue. We have received comments from residents regarding motorbikes using the footways in the area to avoid the restriction, additional physical changes on site or increased enforcement should be investigated.
Recommended action
Traffic order
Maintain current timings of restrictions as it has the maximum impact on traffic looking to avoid the congestion on The Highway. Amend the TMO to include “Police vehicles on any activity”.
Exemptions
The feedback received during the initial consultation and early months of operation of the gateway demonstrated a clear desire to allow disabled residents of Wapping full and unhindered access to all streets in the area without the need for a diversion via The Highway. Therefore, it is proposed to introduce a permit scheme for blue badge users in Wapping. The Traffic signs regulations and general directions allows for the inclusion of a permit holder exception to allow vehicles registered under such a scheme to pass through the restriction, without incurring a penalty. This scheme will need to be included within the signage and traffic order. All blue badge holders that live south of The Highway should have the option to register one vehicle per blue badge holder to be included within an exemption list. A charge of no more than £20 per year will assist the administration of the scheme. The permit scheme will work independently of the on street parking permits issued by the Council so residents with off street parking can still register for an exemption, residents with on street car parking permits will not be able to apply for an exemption if they do not own a blue badge. The bus gateway will be independently numbered so only vehicles registered to this particular gateway will be able to pass; blue badge drivers will not be able to pass any other restriction across the Borough. The principle behind such an exemption scheme should be to allow those for whom alternative routes are not possible, or reasonable, while taking account of the purpose of the scheme to prevent large volumes of non-bus traffic through the bus-gate. In policy terms exemptions for classes of people for whom reasonable alternatives are available would progressively defeat the purpose of the scheme. A similar principle should apply to other gates in Tower Hamlets, be these bus gates or timed closures in ‘school streets’. At this time no further changes to the Wapping bus gateway operation are proposed. However, if further more expansive changes do take place it may be necessary, and would be desirable, to carry out another public consultation.
Signage
Make changes to signs and lines as per the signage review.
Further review
A follow-up review is scheduled in spring 2021, at which time there will be more data available, enabling a more thorough analysis of the impacts of the bus gateway; as is standard practice for Experimental Traffic Orders.
Additional considerations
Consideration has been given to the current coronavirus environment and the working of the bus gateway, leading to the temporary suspension of the gateway during the government lockdown. The data presented throughout this report was obtained prior to Covid-19 lockdown restrictions coming into effect. Therefore, evaluation of any impact has not been reflected, however, the reduced traffic levels under Covid-19 restrictions is not expected to have any adverse effect on the gateway objectives.
Appendices
Average weekday traffic flows 4th to 8th November 2019
Average weekday traffic flows 27th to 31st January 2020
Difference in average traffic flows and speed – before and after gateway
Signage review
See attached document for bus gateway signage review in Wapping